Reporting & Analytics
Statistics
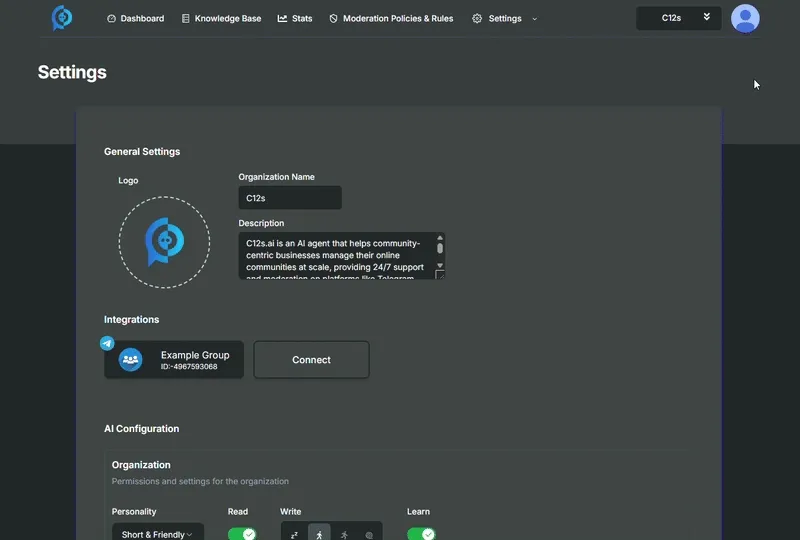
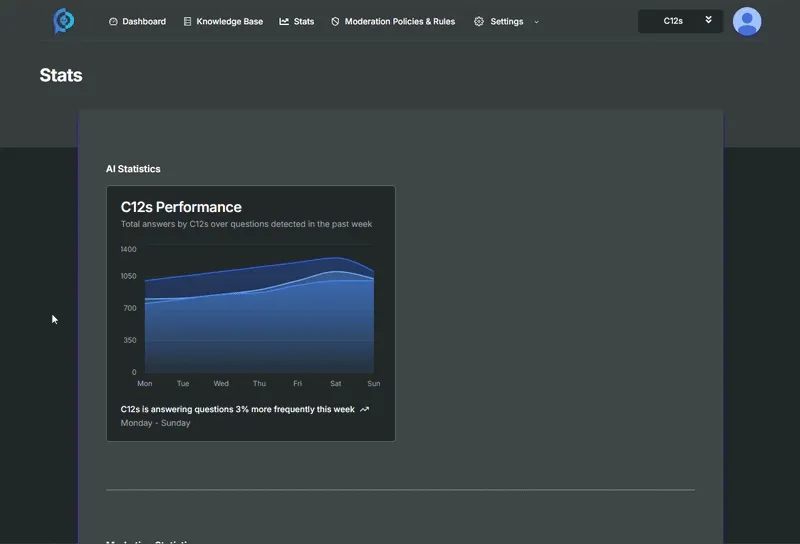
Section titled “Statistics”To access your organization statistics you need to press the “Stats” button that is located on the top menu.
You’ll find some relevant statistics about the C12s bot performance and some metrics regarding the community.
AI Statistics
Section titled “AI Statistics”In the top part of the page you will be able to look at the AI statistics.
For now, the only graph available displays the total number of messages sent across all connected communities, which of these were detected as questions, and which of those questions was C12s able to answer automatically.
We also display a line comparing the current and past week of the bot’s performance.
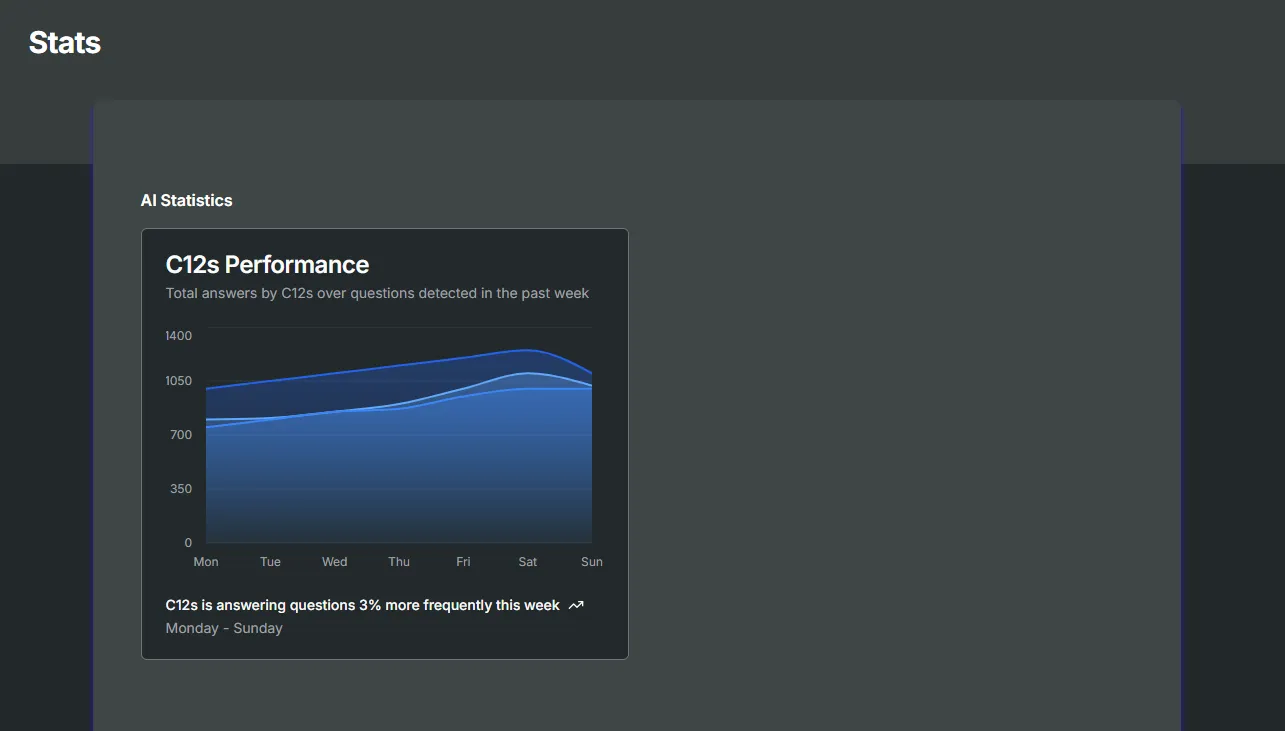
You are also able to hover on top of it to see the exact number of messages the bot has answered for that specific day.
Marketing Statistics
Section titled “Marketing Statistics”In the bottom part of the page you can observe the marketing statistics.
As of the time of writing, there are two graphs:
- Community Engagement - Total unique users across all connected communities and how many are active (weekly), here you can also hover on top of the graph to see more detailed information.
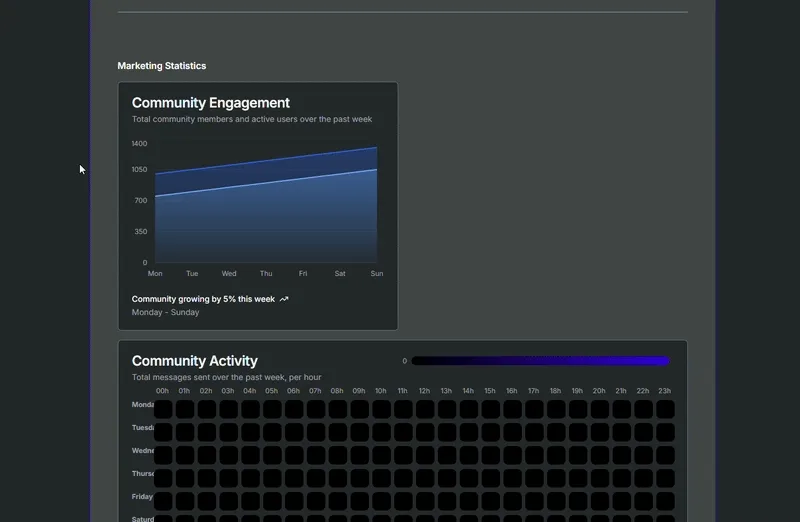
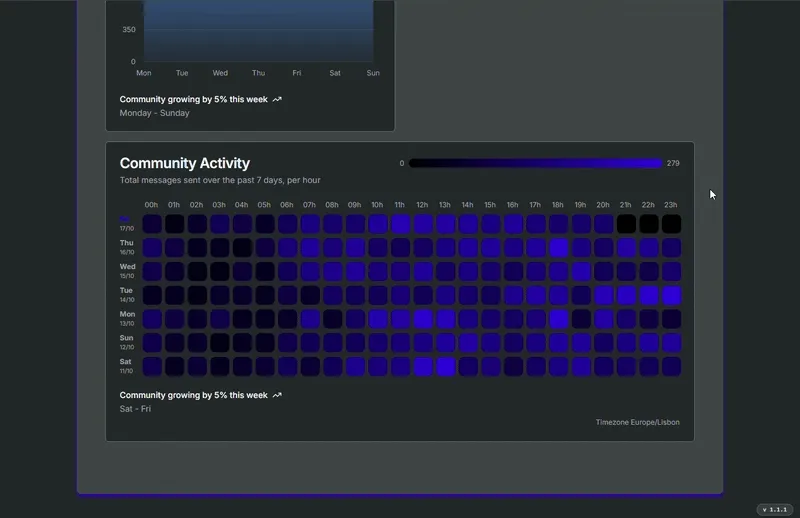
- Community Activity - A map of sent messages by hour, to observe patterns in user activity (such as what are the most and least active time periods in your community per day (horizontally) and per hour (vertically)).